Example
Time Series Graph
In this example we will consider the data of the average cost (in millions of dollars) of a 30-second television ad on the Academy Awards show.
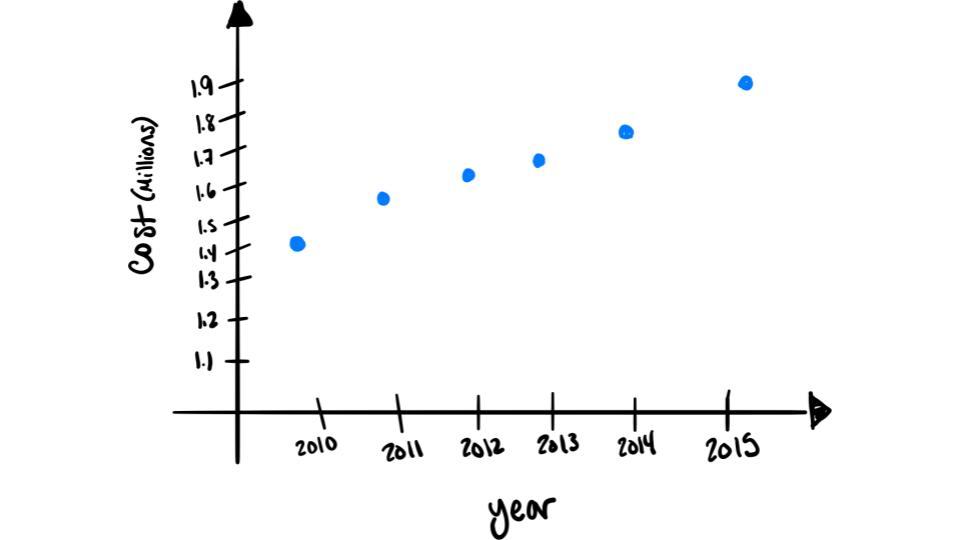
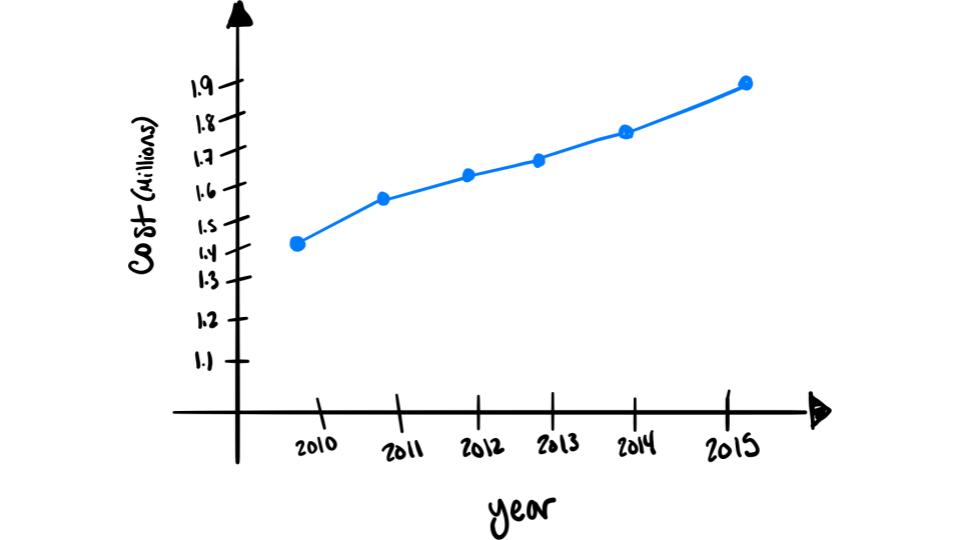
| Year | 2010 | 2011 | 2012 | 2013 | 2014 | 2015 |
| Cost | 1.40 | 1.55 | 1.61 | 1.65 | 1.78 | 1.90 |
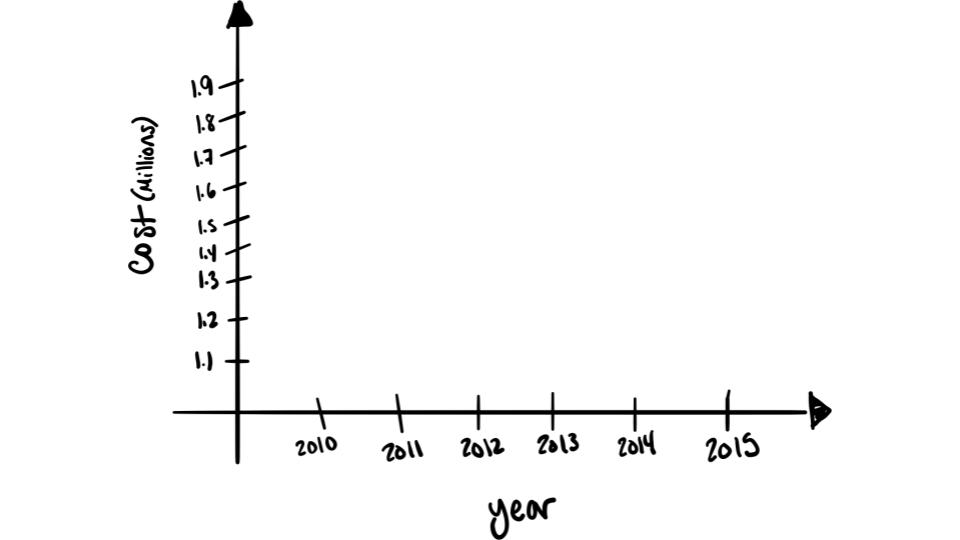
Step 1: Draw and Label the \(x\) and \(y\) axes.

Step 2: Plot the points

Step 3: Connect The Dots

If you would like to see this worked out watch the following video: